
House Prices in Upminster Bridge
House prices in Upminster Bridge have an overall average of £480,108 over the last year.
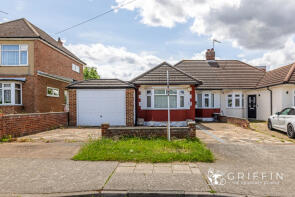
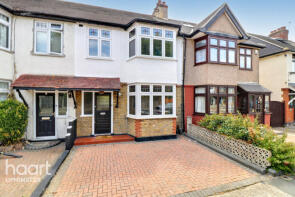
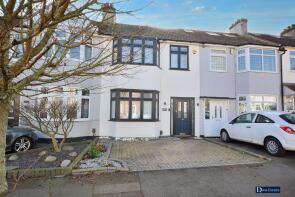
The majority of properties sold in Upminster Bridge during the last year were semi-detached properties, selling for an average price of £503,625. Terraced properties sold for an average of £515,125, with detached properties fetching £473,612.
Overall, the historical sold prices in Upminster Bridge over the last year were 5% up on the previous year and 9% down on the 2022 peak of £529,935.
Properties Sold
39, Newbury Gardens, Upminster RM14 2PS
| Today | See what it's worth now |
| 25 Nov 2025 | £490,000 |
| 22 Oct 2015 | £296,000 |
No other historical records.
26, Newbury Gardens, Upminster RM14 2PS
| Today | See what it's worth now |
| 20 Nov 2025 | £376,000 |
| 19 Dec 1995 | £79,000 |
No other historical records.
20, Falkirk Close, Hornchurch RM11 3QJ
| Today | See what it's worth now |
| 7 Nov 2025 | £515,000 |
| 28 Apr 2016 | £383,500 |
No other historical records.
69, Bridge Avenue, Upminster RM14 2LP
| Today | See what it's worth now |
| 30 Oct 2025 | £565,000 |
| 19 Dec 2014 | £302,000 |
No other historical records.
17, Brookdale Avenue, Upminster RM14 2LS
| Today | See what it's worth now |
| 17 Oct 2025 | £567,500 |
| 26 Jan 2001 | £154,000 |
No other historical records.
59, Clement Way, Upminster RM14 2NX

| Today | See what it's worth now |
| 10 Oct 2025 | £495,000 |
| 15 May 2015 | £329,995 |
No other historical records.
17, Norfolk Road, Upminster RM14 2RE
| Today | See what it's worth now |
| 18 Sep 2025 | £475,000 |
| 16 Mar 2001 | £112,500 |
No other historical records.
55, Bridge Avenue, Upminster RM14 2LP
| Today | See what it's worth now |
| 15 Sep 2025 | £580,000 |
| 29 Jul 2022 | £575,000 |
No other historical records.
47, Aldborough Road, Upminster RM14 2RP
| Today | See what it's worth now |
| 3 Sep 2025 | £495,000 |
| 29 Sep 2021 | £475,000 |
11, Kenley Gardens, Hornchurch RM12 6PD
| Today | See what it's worth now |
| 20 Aug 2025 | £247,225 |
No other historical records.
24a, Granton Avenue, Upminster RM14 2RT
| Today | See what it's worth now |
| 17 Jul 2025 | £330,000 |
| 24 Aug 2021 | £304,000 |
76, Aldborough Road, Upminster RM14 2RP
| Today | See what it's worth now |
| 11 Jul 2025 | £530,500 |
| 20 Oct 2003 | £223,500 |
No other historical records.
35, Clement Way, Upminster RM14 2NX
| Today | See what it's worth now |
| 4 Jul 2025 | £440,500 |
No other historical records.
18, Haydock Close, Hornchurch RM12 6EA
| Today | See what it's worth now |
| 19 Jun 2025 | £315,000 |
| 8 Mar 2019 | £296,000 |
No other historical records.
8, Boundary Road, Upminster RM14 2QS
| Today | See what it's worth now |
| 19 Jun 2025 | £700,000 |
No other historical records.
63, Norfolk Road, Upminster RM14 2RE
| Today | See what it's worth now |
| 30 May 2025 | £560,000 |
| 18 Jul 2019 | £475,000 |
19, Aldborough Road, Upminster RM14 2RJ

| Today | See what it's worth now |
| 31 Mar 2025 | £560,000 |
| 27 Jul 2012 | £315,000 |
63, Granton Avenue, Upminster RM14 2RT
| Today | See what it's worth now |
| 28 Mar 2025 | £575,000 |
No other historical records.
7, 2 4 Abraham Court, St Marys Lane, Upminster RM14 2QD
| Today | See what it's worth now |
| 28 Mar 2025 | £285,000 |
| 11 Jul 2014 | £250,000 |
87, Norfolk Road, Upminster RM14 2RE

| Today | See what it's worth now |
| 28 Mar 2025 | £540,000 |
| 30 Nov 1999 | £100,000 |
8, 2 4 Abraham Court, St Marys Lane, Upminster RM14 2QD
| Today | See what it's worth now |
| 28 Mar 2025 | £295,000 |
| 9 Nov 2007 | £207,000 |
14a, Granton Avenue, Upminster RM14 2RT
| Today | See what it's worth now |
| 27 Mar 2025 | £285,000 |
| 27 May 2002 | £125,000 |
28, Hornminster Glen, Hornchurch RM11 3XL


| Today | See what it's worth now |
| 25 Mar 2025 | £520,000 |
No other historical records.
56, Derby Avenue, Upminster RM14 2NR
| Today | See what it's worth now |
| 25 Mar 2025 | £426,000 |
| 14 Feb 2006 | £235,000 |
No other historical records.
35, Newbury Gardens, Upminster RM14 2PS
| Today | See what it's worth now |
| 24 Mar 2025 | £610,000 |
| 20 Jul 2012 | £250,000 |
Source Acknowledgement: © Crown copyright. England and Wales house price data is publicly available information produced by the HM Land Registry.This material was last updated on 4 February 2026. It covers the period from 1 January 1995 to 24 December 2025 and contains property transactions which have been registered during that period. Contains HM Land Registry data © Crown copyright and database right 2026. This data is licensed under the Open Government Licence v3.0.
Disclaimer: Rightmove.co.uk provides this HM Land Registry data "as is". The burden for fitness of the data relies completely with the user and is provided for informational purposes only. No warranty, express or implied, is given relating to the accuracy of content of the HM Land Registry data and Rightmove does not accept any liability for error or omission. If you have found an error with the data or need further information please contact HM Land Registry.
Permitted Use: Viewers of this Information are granted permission to access this Crown copyright material and to download it onto electronic, magnetic, optical or similar storage media provided that such activities are for private research, study or in-house use only. Any other use of the material requires the formal written permission of Land Registry which can be requested from us, and is subject to an additional licence and associated charge.
Map data ©OpenStreetMap contributors.
Rightmove takes no liability for your use of, or reliance on, Rightmove's Instant Valuation due to the limitations of our tracking tool listed here. Use of this tool is taken entirely at your own risk. All rights reserved.