
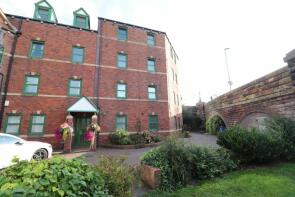
House Prices in CA2
House prices in CA2 have an overall average of £163,513 over the last year.
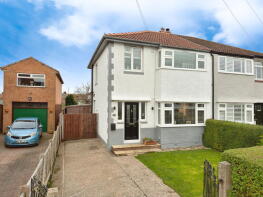
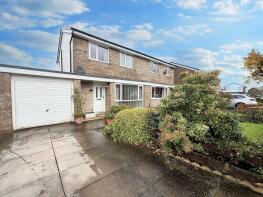
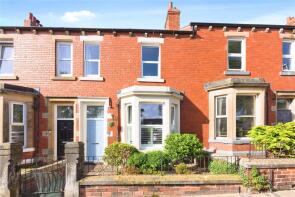
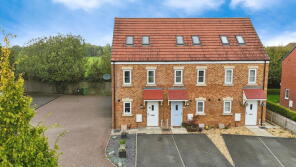
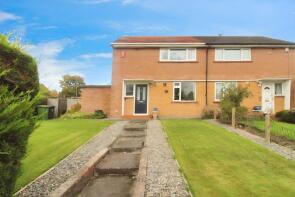
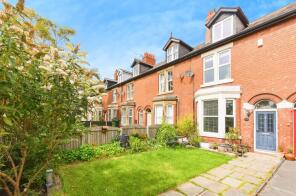
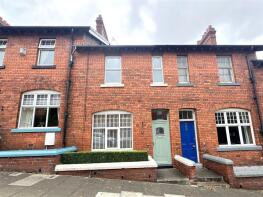
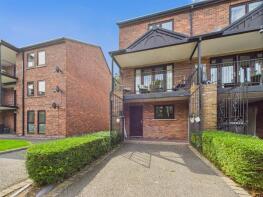
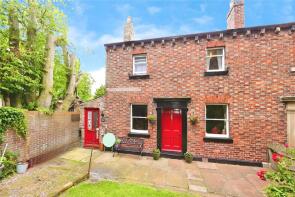
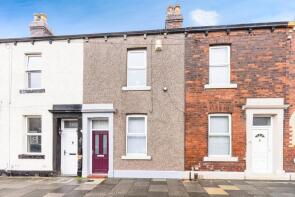
The majority of properties sold in CA2 during the last year were semi-detached properties, selling for an average price of £171,401. Terraced properties sold for an average of £126,330, with detached properties fetching £293,168.
Overall, the historical sold prices in CA2 over the last year were 2% up on the previous year and 9% up on the 2023 peak of £149,387.
Properties Sold
8, Nelson Bridge Court, Sheffield Street, Carlisle CA2 5DT
| Today | See what it's worth now |
| 24 Apr 2026 | £112,500 |
| 11 Jul 2013 | £72,000 |
No other historical records.
64, Inglewood Crescent, Carlisle CA2 6JL
| Today | See what it's worth now |
| 17 Apr 2026 | £179,950 |
| 27 Mar 2015 | £108,000 |
25, Montreal Street, Carlisle CA2 4EE

| Today | See what it's worth now |
| 17 Apr 2026 | £110,000 |
| 2 Nov 2023 | £90,000 |
Extensions and planning permission in CA2
See planning approval stats, extension build costs and value added estimates.

45, Norfolk Street, Carlisle CA2 5HU

| Today | See what it's worth now |
| 17 Apr 2026 | £142,000 |
| 28 Nov 2014 | £104,000 |
14, Carvoran Way, Carlisle CA2 7XJ
| Today | See what it's worth now |
| 17 Apr 2026 | £210,000 |
| 22 Oct 2004 | £139,950 |
No other historical records.
69, Nelson Street, Carlisle CA2 5NE
| Today | See what it's worth now |
| 17 Apr 2026 | £197,500 |
| 22 Sep 2021 | £162,500 |
61, Bleaberry Way, Carlisle CA2 6RF
| Today | See what it's worth now |
| 10 Apr 2026 | £157,500 |
| 29 Jun 2023 | £145,000 |
250, Brookside, Carlisle CA2 7JU
| Today | See what it's worth now |
| 10 Apr 2026 | £142,000 |
| 12 Dec 2014 | £80,000 |
No other historical records.
150, Newtown Road, Carlisle CA2 7LT
| Today | See what it's worth now |
| 10 Apr 2026 | £173,000 |
| 28 Sep 2018 | £133,500 |
9, South Western Terrace, Carlisle CA2 4AY
| Today | See what it's worth now |
| 10 Apr 2026 | £149,000 |
| 22 Sep 2023 | £125,000 |
84a, Castlesteads Drive, Carlisle CA2 7XD
| Today | See what it's worth now |
| 8 Apr 2026 | £227,500 |
| 6 Sep 2016 | £152,000 |
No other historical records.
18, Waterside House, Denton Mill Close, Carlisle CA2 5HF
| Today | See what it's worth now |
| 2 Apr 2026 | £138,000 |
| 12 Dec 2013 | £137,500 |
1, Redfern Court, Upperby Road, Carlisle CA2 4JL

| Today | See what it's worth now |
| 2 Apr 2026 | £175,000 |
| 26 Jun 2020 | £151,000 |
27, North Street, Carlisle CA2 5LN

| Today | See what it's worth now |
| 2 Apr 2026 | £87,500 |
| 18 Jan 2019 | £75,000 |
13, Harvey Street, Carlisle CA2 7NX
| Today | See what it's worth now |
| 2 Apr 2026 | £141,000 |
| 20 Dec 2022 | £128,500 |
10, Fairfield Gardens, Carlisle CA2 7EW
| Today | See what it's worth now |
| 1 Apr 2026 | £57,500 |
| 4 Aug 2003 | £37,500 |
60, Caldew Maltings, Carlisle CA2 5SW
| Today | See what it's worth now |
| 1 Apr 2026 | £125,000 |
| 27 Apr 2018 | £110,000 |
22, Bridge Terrace, Denton Street, Carlisle CA2 5LL
| Today | See what it's worth now |
| 30 Mar 2026 | £180,000 |
| 20 Aug 2009 | £143,000 |
185, Denton Street, Carlisle CA2 5JP
| Today | See what it's worth now |
| 30 Mar 2026 | £92,500 |
| 7 Oct 2022 | £85,000 |
8, Johnson Mill, Denton Mill Lane, Carlisle CA2 5NQ
| Today | See what it's worth now |
| 27 Mar 2026 | £75,000 |
| 17 Apr 2003 | £59,950 |
61, Currock Road, Carlisle CA2 4BH

| Today | See what it's worth now |
| 27 Mar 2026 | £180,000 |
| 15 Sep 2023 | £165,000 |
6, Dunlin Close, Carlisle CA2 7FJ
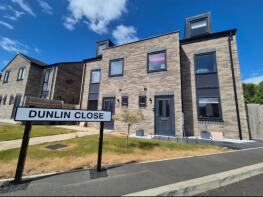
| Today | See what it's worth now |
| 27 Mar 2026 | £220,000 |
| 22 Sep 2021 | £185,000 |
No other historical records.
68, Chesterholm, Carlisle CA2 7XX
| Today | See what it's worth now |
| 26 Mar 2026 | £234,000 |
| 14 Oct 2005 | £130,000 |
Source Acknowledgement: © Crown copyright. England and Wales house price data is publicly available information produced by the HM Land Registry.This material was last updated on 9 July 2026. It covers the period from 1 January 1995 to 30 April 2026 and contains property transactions which have been registered during that period. Contains HM Land Registry data © Crown copyright and database right 2026. This data is licensed under the Open Government Licence v3.0.
Disclaimer: Rightmove.co.uk provides this HM Land Registry data "as is". The burden for fitness of the data relies completely with the user and is provided for informational purposes only. No warranty, express or implied, is given relating to the accuracy of content of the HM Land Registry data and Rightmove does not accept any liability for error or omission. If you have found an error with the data or need further information please contact HM Land Registry.
Permitted Use: Viewers of this Information are granted permission to access this Crown copyright material and to download it onto electronic, magnetic, optical or similar storage media provided that such activities are for private research, study or in-house use only. Any other use of the material requires the formal written permission of Land Registry which can be requested from us, and is subject to an additional licence and associated charge.
Rightmove takes no liability for your use of, or reliance on, Rightmove's Instant Valuation due to the limitations of our tracking tool listed here. Use of this tool is taken entirely at your own risk. All rights reserved.