
House Prices in CH5
House prices in CH5 have an overall average of £224,586 over the last year.
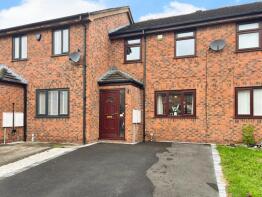
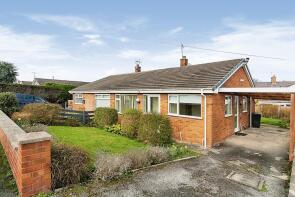
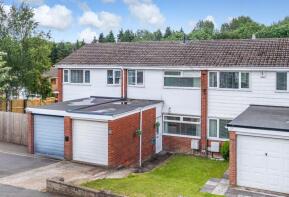
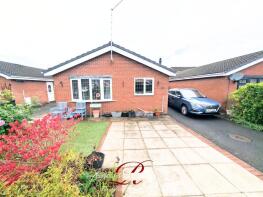
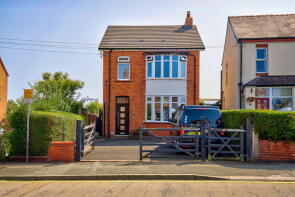
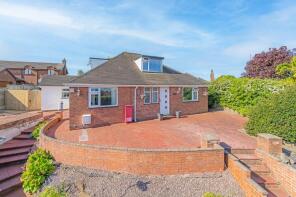
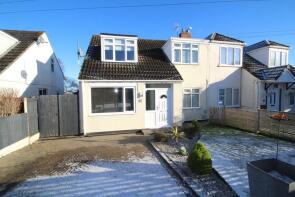
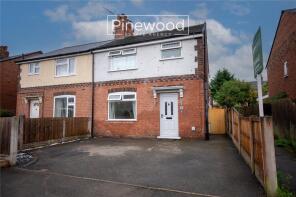
The majority of properties sold in CH5 during the last year were semi-detached properties, selling for an average price of £195,872. Detached properties sold for an average of £316,597, with terraced properties fetching £154,325.
Overall, the historical sold prices in CH5 over the last year were 3% down on the previous year and 3% up on the 2022 peak of £218,556.
Properties Sold
11, Brook Lane, Deeside CH5 3PR

| Today | See what it's worth now |
| 24 Apr 2026 | £217,500 |
| 12 Dec 2003 | £92,950 |
No other historical records.
33, Viking Way, Deeside CH5 4JW
| Today | See what it's worth now |
| 24 Apr 2026 | £221,000 |
| 30 Nov 2020 | £176,000 |
6, Hilltop Close, Deeside CH5 3HA
| Today | See what it's worth now |
| 17 Apr 2026 | £178,500 |
| 24 Jun 2022 | £155,000 |
16, Fern Close, Deeside CH5 4FJ

| Today | See what it's worth now |
| 17 Apr 2026 | £205,000 |
| 3 Jun 2024 | £195,000 |
3, Brunswood Green, Deeside CH5 3JA
| Today | See what it's worth now |
| 17 Apr 2026 | £175,000 |
| 5 Sep 1997 | £39,500 |
No other historical records.
15, Bodnant Grove, Deeside CH5 4NA
| Today | See what it's worth now |
| 17 Apr 2026 | £150,000 |
| 13 Apr 2010 | £102,000 |
No other historical records.
4, Nefyn Close, Deeside CH5 4YD

| Today | See what it's worth now |
| 10 Apr 2026 | £205,000 |
| 11 Mar 2022 | £165,000 |
No other historical records.
34, Field Park, Deeside CH5 4QT
| Today | See what it's worth now |
| 8 Apr 2026 | £220,000 |
| 7 Jun 2018 | £147,500 |
68, Hillsdown Drive, Deeside CH5 4GQ
| Today | See what it's worth now |
| 7 Apr 2026 | £292,500 |
| 19 Jun 2020 | £180,000 |
19, Park Avenue, Deeside CH5 3HY
| Today | See what it's worth now |
| 2 Apr 2026 | £420,000 |
| 12 May 2023 | £350,000 |
35, Westminster Crescent, Deeside CH5 1JX
| Today | See what it's worth now |
| 1 Apr 2026 | £160,000 |
| 23 Jul 2021 | £127,500 |
5, Meadow View, Deeside CH5 2SQ
| Today | See what it's worth now |
| 30 Mar 2026 | £160,000 |
| 30 Nov 2011 | £100,000 |
No other historical records.
10, Taynton Close, Deeside CH5 4RT

| Today | See what it's worth now |
| 27 Mar 2026 | £201,000 |
| 14 Jul 2023 | £163,500 |
53, Caernarvon Close, Deeside CH5 1AS
| Today | See what it's worth now |
| 27 Mar 2026 | £192,500 |
| 26 Mar 2021 | £160,000 |
4, Aspen Close, Deeside CH5 4GY

| Today | See what it's worth now |
| 27 Mar 2026 | £165,000 |
| 9 Jul 2021 | £128,000 |
6, Hollowbrook Drive, Deeside CH5 4GF
| Today | See what it's worth now |
| 27 Mar 2026 | £260,000 |
| 19 Dec 2003 | £145,000 |
No other historical records.
36, Hamilton Avenue, Sandycroft CH5 2PB
| Today | See what it's worth now |
| 24 Mar 2026 | £120,000 |
No other historical records.
12, Grange Court, Deeside CH5 2EZ
| Today | See what it's worth now |
| 20 Mar 2026 | £215,000 |
| 20 May 2015 | £159,000 |
No other historical records.
62, Green Lane, Deeside CH5 1LE
| Today | See what it's worth now |
| 20 Mar 2026 | £135,000 |
| 1 Feb 2021 | £105,000 |
37, Mold Road, Deeside CH5 4QL
| Today | See what it's worth now |
| 20 Mar 2026 | £245,000 |
| 11 Feb 2022 | £210,000 |
15, Wood Lane, Deeside CH5 3JD
| Today | See what it's worth now |
| 20 Mar 2026 | £305,000 |
| 28 Feb 2020 | £257,000 |
No other historical records.
4, Pengwladys Avenue, Deeside CH5 4LA
| Today | See what it's worth now |
| 17 Mar 2026 | £197,500 |
| 1 Apr 2005 | £115,000 |
6, The Nook, Deeside CH5 2BQ
| Today | See what it's worth now |
| 16 Mar 2026 | £225,000 |
| 6 Nov 2020 | £120,000 |
No other historical records.
Source Acknowledgement: © Crown copyright. England and Wales house price data is publicly available information produced by the HM Land Registry.This material was last updated on 9 July 2026. It covers the period from 1 January 1995 to 30 April 2026 and contains property transactions which have been registered during that period. Contains HM Land Registry data © Crown copyright and database right 2026. This data is licensed under the Open Government Licence v3.0.
Disclaimer: Rightmove.co.uk provides this HM Land Registry data "as is". The burden for fitness of the data relies completely with the user and is provided for informational purposes only. No warranty, express or implied, is given relating to the accuracy of content of the HM Land Registry data and Rightmove does not accept any liability for error or omission. If you have found an error with the data or need further information please contact HM Land Registry.
Permitted Use: Viewers of this Information are granted permission to access this Crown copyright material and to download it onto electronic, magnetic, optical or similar storage media provided that such activities are for private research, study or in-house use only. Any other use of the material requires the formal written permission of Land Registry which can be requested from us, and is subject to an additional licence and associated charge.
Rightmove takes no liability for your use of, or reliance on, Rightmove's Instant Valuation due to the limitations of our tracking tool listed here. Use of this tool is taken entirely at your own risk. All rights reserved.