
House Prices in CH7
House prices in CH7 have an overall average of £249,065 over the last year.
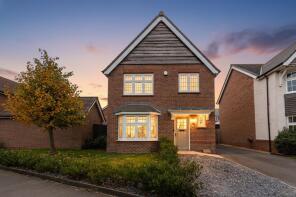
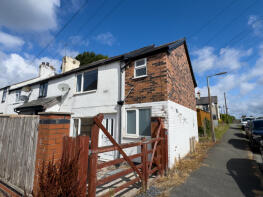
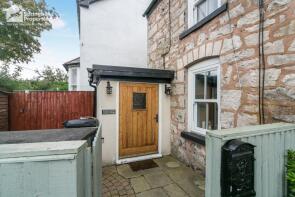
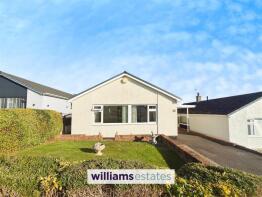
The majority of properties sold in CH7 during the last year were detached properties, selling for an average price of £323,439. Semi-detached properties sold for an average of £200,183, with terraced properties fetching £171,867.
Overall, the historical sold prices in CH7 over the last year were 2% down on the previous year and similar to the 2022 peak of £250,194.
Properties Sold
5, Brindle Close, Buckley CH7 3FB
| Today | See what it's worth now |
| 22 Apr 2026 | £320,000 |
| 30 Nov 2012 | £199,995 |
No other historical records.
9, Victoria Road, Buckley CH7 2HD
| Today | See what it's worth now |
| 17 Apr 2026 | £75,000 |
| 23 Jul 2009 | £82,500 |
3 October Cottage, Mill Terrace, County Boundary A541, Mold CH7 5UF
| Today | See what it's worth now |
| 16 Apr 2026 | £160,000 |
| 19 Dec 2019 | £136,000 |
6, Oakwood Close, Mold CH7 1RS
| Today | See what it's worth now |
| 10 Apr 2026 | £215,000 |
| 17 Mar 2000 | £74,000 |
No other historical records.
23, Farm Road, Buckley CH7 2NY
| Today | See what it's worth now |
| 7 Apr 2026 | £135,000 |
| 20 Jul 2004 | £95,000 |
30 Glenvine, Bryn Awelon, Mold CH7 1LU
| Today | See what it's worth now |
| 7 Apr 2026 | £245,000 |
| 10 May 1996 | £50,000 |
No other historical records.
32, Hawthorne Avenue, Buckley CH7 2QN

| Today | See what it's worth now |
| 7 Apr 2026 | £235,000 |
| 16 Jan 2007 | £158,000 |
95, Parc Hendy, Mold CH7 1TT
| Today | See what it's worth now |
| 2 Apr 2026 | £302,000 |
| 4 Aug 2023 | £299,000 |
3, Warren Crescent, Buckley CH7 3BZ
| Today | See what it's worth now |
| 2 Apr 2026 | £170,000 |
| 20 Oct 2000 | £48,000 |
No other historical records.
40, Llys Wylfa, Mold CH7 6XB

| Today | See what it's worth now |
| 1 Apr 2026 | £180,000 |
| 14 Feb 2018 | £134,000 |
2, Sunny Ridge, Mold CH7 1RU
| Today | See what it's worth now |
| 1 Apr 2026 | £220,000 |
| 8 Aug 2025 | £180,000 |
No other historical records.
3, Pen Y Maes, Buckley CH7 2QD
| Today | See what it's worth now |
| 1 Apr 2026 | £230,000 |
| 21 Oct 2019 | £181,000 |
25, Caerphilly Road, Buckley CH7 3QJ
| Today | See what it's worth now |
| 27 Mar 2026 | £350,000 |
| 17 Dec 2021 | £252,000 |
4, Ffordd Ty'n Y Coed, Mold CH7 1FS
| Today | See what it's worth now |
| 27 Mar 2026 | £216,000 |
| 18 Dec 2020 | £182,500 |
4, Criccieth Close, Buckley CH7 3QF
| Today | See what it's worth now |
| 27 Mar 2026 | £265,000 |
| 5 Aug 2013 | £165,000 |
11 Hilly Thorpe Villa, Padeswood Road North, Buckley CH7 2JL
| Today | See what it's worth now |
| 27 Mar 2026 | £140,000 |
| 18 Sep 2014 | £137,000 |
Karinya, Brickfields, Buckley CH7 3BE
| Today | See what it's worth now |
| 27 Mar 2026 | £345,000 |
No other historical records.
10, Is Y Coed, Mold CH7 1JJ
| Today | See what it's worth now |
| 27 Mar 2026 | £315,000 |
| 18 Oct 2022 | £295,000 |
48, Ffordd Trebeirdd, Mold CH7 1FJ
| Today | See what it's worth now |
| 27 Mar 2026 | £143,500 |
| 27 Mar 2026 | £143,500 |
32, Langford Crescent, Buckley CH7 2PR
| Today | See what it's worth now |
| 27 Mar 2026 | £240,000 |
| 6 Mar 2020 | £189,950 |
No other historical records.
19, Crud Y Gwynt, Mold CH7 6TB
| Today | See what it's worth now |
| 25 Mar 2026 | £377,500 |
| 26 Aug 2011 | £250,000 |
No other historical records.
2, Heathland Close, Buckley CH7 3GE
| Today | See what it's worth now |
| 25 Mar 2026 | £150,500 |
| 20 Dec 2018 | £175,000 |
6, Wood Green, Mold CH7 1UG
| Today | See what it's worth now |
| 20 Mar 2026 | £230,000 |
No other historical records.
Source Acknowledgement: © Crown copyright. England and Wales house price data is publicly available information produced by the HM Land Registry.This material was last updated on 9 July 2026. It covers the period from 1 January 1995 to 30 April 2026 and contains property transactions which have been registered during that period. Contains HM Land Registry data © Crown copyright and database right 2026. This data is licensed under the Open Government Licence v3.0.
Disclaimer: Rightmove.co.uk provides this HM Land Registry data "as is". The burden for fitness of the data relies completely with the user and is provided for informational purposes only. No warranty, express or implied, is given relating to the accuracy of content of the HM Land Registry data and Rightmove does not accept any liability for error or omission. If you have found an error with the data or need further information please contact HM Land Registry.
Permitted Use: Viewers of this Information are granted permission to access this Crown copyright material and to download it onto electronic, magnetic, optical or similar storage media provided that such activities are for private research, study or in-house use only. Any other use of the material requires the formal written permission of Land Registry which can be requested from us, and is subject to an additional licence and associated charge.
Rightmove takes no liability for your use of, or reliance on, Rightmove's Instant Valuation due to the limitations of our tracking tool listed here. Use of this tool is taken entirely at your own risk. All rights reserved.