
House Prices in Mannamead
House prices in Mannamead have an overall average of £310,695 over the last year.
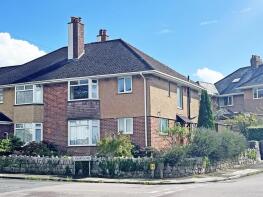
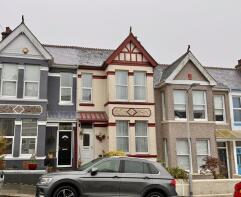
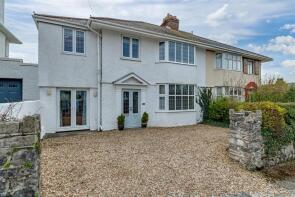
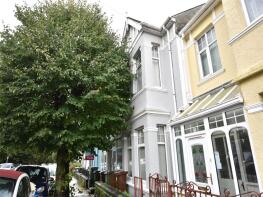
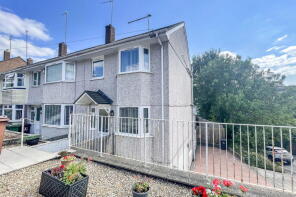
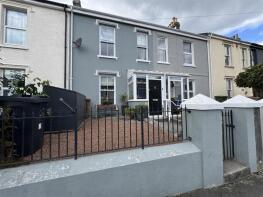
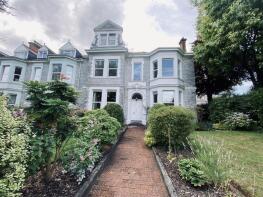
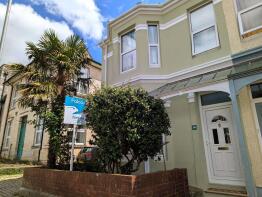
The majority of properties sold in Mannamead during the last year were terraced properties, selling for an average price of £301,059. Flats sold for an average of £169,606, with semi-detached properties fetching £381,775.
Overall, the historical sold prices in Mannamead over the last year were similar to the previous year and 4% up on the 2023 peak of £297,465.
Properties Sold
Flat 2, 23, Hartley Road, Plymouth PL3 5LW
| Today | See what it's worth now |
| 17 Apr 2026 | £275,000 |
| 4 Dec 2018 | £360,000 |
No other historical records.
27, Widey View, Plymouth PL3 5JQ
| Today | See what it's worth now |
| 17 Apr 2026 | £234,000 |
| 1 Sep 2021 | £140,000 |
No other historical records.
45, Blandford Road, Plymouth PL3 5DS

| Today | See what it's worth now |
| 14 Apr 2026 | £230,000 |
| 25 Mar 2020 | £175,000 |
No other historical records.
14, Fortescue Place, Plymouth PL3 5HT
| Today | See what it's worth now |
| 8 Apr 2026 | £435,000 |
| 13 Nov 2020 | £257,500 |
No other historical records.
1, Hartley Court, Plymouth PL3 5JN
| Today | See what it's worth now |
| 2 Apr 2026 | £141,000 |
| 29 Jun 2021 | £125,000 |
Flat 3, 154, Mannamead Road, Plymouth PL3 5QL
| Today | See what it's worth now |
| 1 Apr 2026 | £52,500 |
| 10 Aug 2007 | £135,000 |
No other historical records.
4, Priory Lawn Terrace, Plymouth PL3 5EA
| Today | See what it's worth now |
| 26 Mar 2026 | £188,000 |
| 1 Jun 2021 | £150,000 |
3, Quarry Park Road, Peverell, Plymouth PL3 4LW
| Today | See what it's worth now |
| 20 Mar 2026 | £315,000 |
| 6 Jan 2012 | £180,000 |
No other historical records.
7, Edgar Terrace, Plymouth PL4 7HQ

| Today | See what it's worth now |
| 19 Mar 2026 | £133,500 |
| 16 Jan 2012 | £113,000 |
10, Glenwood Road, Plymouth PL3 5NH
| Today | See what it's worth now |
| 19 Mar 2026 | £330,000 |
| 5 Mar 2021 | £280,000 |
1, Verden Close, Plymouth PL3 4BT
| Today | See what it's worth now |
| 18 Mar 2026 | £385,000 |
| 27 Apr 2018 | £260,000 |
40, Whiteford Road, Plymouth PL3 5LX
| Today | See what it's worth now |
| 18 Mar 2026 | £550,000 |
| 3 Sep 2015 | £400,000 |
27, Elim Court, Elim Terrace, Plymouth PL3 4QB
| Today | See what it's worth now |
| 11 Mar 2026 | £93,500 |
| 29 Jun 2011 | £95,000 |
27, Wesley Avenue, Plymouth PL3 4RA
| Today | See what it's worth now |
| 11 Mar 2026 | £300,000 |
| 30 Mar 2021 | £240,000 |
47, Tor Road, Plymouth PL3 5TG
| Today | See what it's worth now |
| 9 Mar 2026 | £385,000 |
No other historical records.
46, Ganna Park Road, Plymouth PL3 4NN
| Today | See what it's worth now |
| 5 Mar 2026 | £225,000 |
| 24 May 1996 | £41,000 |
No other historical records.
7, Venn Way, Plymouth PL3 5PN
| Today | See what it's worth now |
| 2 Mar 2026 | £555,000 |
| 13 Aug 2010 | £235,000 |
No other historical records.
66a, Priory Road, Plymouth PL3 5ER

| Today | See what it's worth now |
| 27 Feb 2026 | £110,000 |
| 15 Dec 2023 | £106,000 |
18, College Avenue, Plymouth PL4 7AN
| Today | See what it's worth now |
| 27 Feb 2026 | £95,000 |
| 11 Jul 2025 | £150,000 |
2a, Ashford Crescent, Plymouth PL3 5AA
| Today | See what it's worth now |
| 20 Feb 2026 | £255,000 |
| 18 Aug 2020 | £190,000 |
5, Fortescue Place, Plymouth PL3 5HT
| Today | See what it's worth now |
| 20 Feb 2026 | £347,500 |
| 17 Apr 2008 | £208,000 |
Flat 1, 107, Mannamead Road, Plymouth PL3 5LJ
| Today | See what it's worth now |
| 6 Feb 2026 | £174,000 |
| 19 Sep 1997 | £51,500 |
No other historical records.
1, Westbourne Road, Plymouth PL3 4LH
| Today | See what it's worth now |
| 6 Feb 2026 | £285,000 |
| 25 Sep 2018 | £210,000 |
Source Acknowledgement: © Crown copyright. England and Wales house price data is publicly available information produced by the HM Land Registry.This material was last updated on 9 July 2026. It covers the period from 1 January 1995 to 30 April 2026 and contains property transactions which have been registered during that period. Contains HM Land Registry data © Crown copyright and database right 2026. This data is licensed under the Open Government Licence v3.0.
Disclaimer: Rightmove.co.uk provides this HM Land Registry data "as is". The burden for fitness of the data relies completely with the user and is provided for informational purposes only. No warranty, express or implied, is given relating to the accuracy of content of the HM Land Registry data and Rightmove does not accept any liability for error or omission. If you have found an error with the data or need further information please contact HM Land Registry.
Permitted Use: Viewers of this Information are granted permission to access this Crown copyright material and to download it onto electronic, magnetic, optical or similar storage media provided that such activities are for private research, study or in-house use only. Any other use of the material requires the formal written permission of Land Registry which can be requested from us, and is subject to an additional licence and associated charge.
Rightmove takes no liability for your use of, or reliance on, Rightmove's Instant Valuation due to the limitations of our tracking tool listed here. Use of this tool is taken entirely at your own risk. All rights reserved.