
House Prices in NG4
House prices in NG4 have an overall average of £246,782 over the last year.
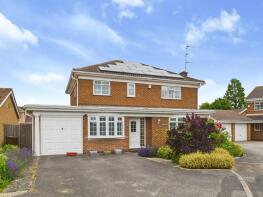
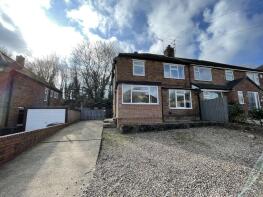
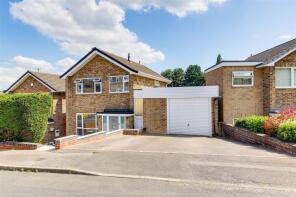
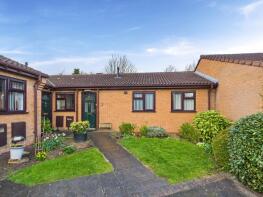
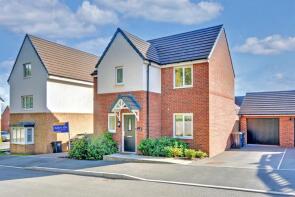
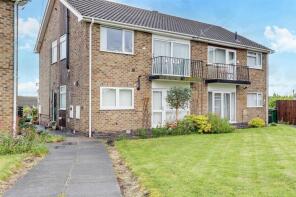
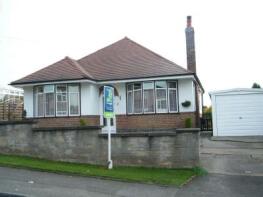
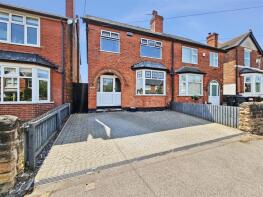
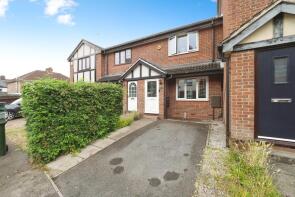
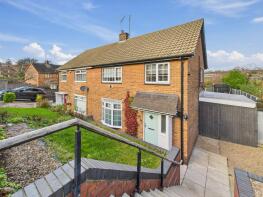
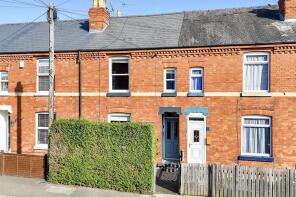
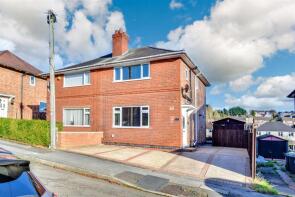
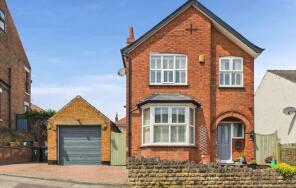
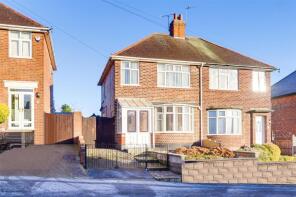
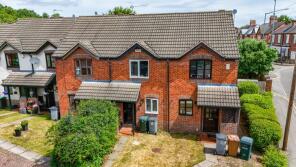
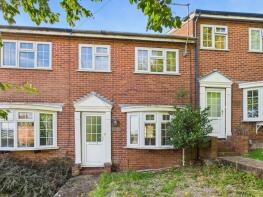
The majority of properties sold in NG4 during the last year were semi-detached properties, selling for an average price of £228,545. Detached properties sold for an average of £338,507, with terraced properties fetching £178,590.
Overall, the historical sold prices in NG4 over the last year were 1% up on the previous year and 6% up on the 2023 peak of £233,369.
Properties Sold
12, Conisbrough Avenue, Nottingham NG4 2RE
| Today | See what it's worth now |
| 24 Apr 2026 | £440,000 |
| 25 Oct 2013 | £285,000 |
9, Coronation Walk, Nottingham NG4 4AS
| Today | See what it's worth now |
| 15 Apr 2026 | £215,000 |
| 12 Mar 2004 | £105,000 |
No other historical records.
106, Southcliffe Road, Nottingham NG4 1ES
| Today | See what it's worth now |
| 15 Apr 2026 | £275,000 |
| 29 Nov 2019 | £167,000 |
No other historical records.
Extensions and planning permission in NG4
See planning approval stats, extension build costs and value added estimates.

17, Manor Green Walk, Nottingham NG4 3BW
| Today | See what it's worth now |
| 13 Apr 2026 | £190,000 |
| 6 Sep 2021 | £145,000 |
15, Withnall Close, Nottingham NG4 4LL
| Today | See what it's worth now |
| 10 Apr 2026 | £318,000 |
| 27 Sep 2022 | £310,000 |
No other historical records.
7, Orchard Court, Thoresby Avenue, Nottingham NG4 4FF
| Today | See what it's worth now |
| 10 Apr 2026 | £160,000 |
| 14 Feb 2014 | £89,500 |
No other historical records.
10, Cromford Avenue, Nottingham NG4 3RU
| Today | See what it's worth now |
| 8 Apr 2026 | £275,000 |
| 17 Aug 2011 | £175,000 |
No other historical records.
8, Blackhill Drive, Nottingham NG4 3FT
| Today | See what it's worth now |
| 7 Apr 2026 | £295,000 |
| 13 May 2021 | £250,000 |
21, The Elms, Nottingham NG4 2FW
| Today | See what it's worth now |
| 2 Apr 2026 | £170,000 |
| 12 Jan 2021 | £135,500 |
22, Wollaton Avenue, Nottingham NG4 4HX
| Today | See what it's worth now |
| 2 Apr 2026 | £231,000 |
| 5 Nov 2018 | £125,000 |
No other historical records.
5, Park Road, Nottingham NG4 3DE
| Today | See what it's worth now |
| 2 Apr 2026 | £220,000 |
| 15 Sep 2020 | £192,500 |
7, Marwood Crescent, Nottingham NG4 3PW
| Today | See what it's worth now |
| 1 Apr 2026 | £242,000 |
| 9 Jun 2008 | £85,500 |
No other historical records.
17a, Carnarvon Grove, Nottingham NG4 1RP
| Today | See what it's worth now |
| 31 Mar 2026 | £275,000 |
| 14 Jan 2011 | £119,950 |
No other historical records.
5, Perlethorpe Crescent, Nottingham NG4 4GL

| Today | See what it's worth now |
| 31 Mar 2026 | £225,000 |
| 19 Sep 2008 | £125,000 |
6, Highgate Close, Nottingham NG4 3PP
| Today | See what it's worth now |
| 27 Mar 2026 | £210,000 |
| 24 Nov 2017 | £143,500 |
No other historical records.
4, Forester Grove, Nottingham NG4 1FR
| Today | See what it's worth now |
| 27 Mar 2026 | £287,730 |
| 10 Feb 2023 | £149,000 |
No other historical records.
12, Godfrey Street, Nottingham NG4 2JG
| Today | See what it's worth now |
| 27 Mar 2026 | £178,000 |
| 19 May 1995 | £34,000 |
No other historical records.
14, Highfield Drive, Nottingham NG4 1JQ
| Today | See what it's worth now |
| 27 Mar 2026 | £145,000 |
| 20 May 2014 | £80,000 |
No other historical records.
28, First Avenue, Nottingham NG4 2DX
| Today | See what it's worth now |
| 27 Mar 2026 | £285,000 |
| 12 Nov 2007 | £159,950 |
17, Swan Meadow, Nottingham NG4 2ET
| Today | See what it's worth now |
| 27 Mar 2026 | £500,000 |
| 21 Mar 2019 | £370,000 |
27, Shearing Close, Nottingham NG4 3GJ
| Today | See what it's worth now |
| 27 Mar 2026 | £138,000 |
| 7 Sep 2012 | £81,000 |
7, Forester Grove, Nottingham NG4 1FR
| Today | See what it's worth now |
| 27 Mar 2026 | £310,000 |
| 17 Jun 2016 | £217,500 |
49, Prospect Road, Carlton NG4 1LX
| Today | See what it's worth now |
| 26 Mar 2026 | £207,500 |
No other historical records.
Source Acknowledgement: © Crown copyright. England and Wales house price data is publicly available information produced by the HM Land Registry.This material was last updated on 9 July 2026. It covers the period from 1 January 1995 to 30 April 2026 and contains property transactions which have been registered during that period. Contains HM Land Registry data © Crown copyright and database right 2026. This data is licensed under the Open Government Licence v3.0.
Disclaimer: Rightmove.co.uk provides this HM Land Registry data "as is". The burden for fitness of the data relies completely with the user and is provided for informational purposes only. No warranty, express or implied, is given relating to the accuracy of content of the HM Land Registry data and Rightmove does not accept any liability for error or omission. If you have found an error with the data or need further information please contact HM Land Registry.
Permitted Use: Viewers of this Information are granted permission to access this Crown copyright material and to download it onto electronic, magnetic, optical or similar storage media provided that such activities are for private research, study or in-house use only. Any other use of the material requires the formal written permission of Land Registry which can be requested from us, and is subject to an additional licence and associated charge.
Rightmove takes no liability for your use of, or reliance on, Rightmove's Instant Valuation due to the limitations of our tracking tool listed here. Use of this tool is taken entirely at your own risk. All rights reserved.