
House Prices in Oakhill
House prices in Oakhill have an overall average of £422,000 over the last year.
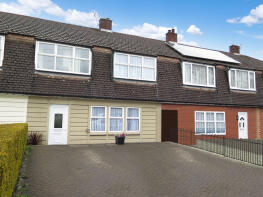
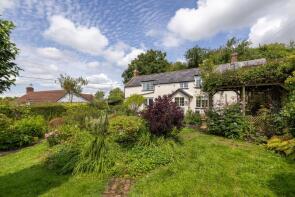
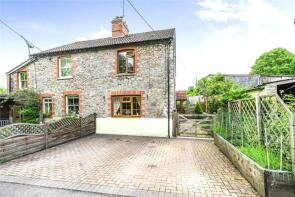
The majority of properties sold in Oakhill during the last year were detached properties, selling for an average price of £483,333. Semi-detached properties sold for an average of £420,000, with terraced properties fetching £240,000.
Overall, the historical sold prices in Oakhill over the last year were 1% up on the previous year and 25% down on the 2022 peak of £559,886.
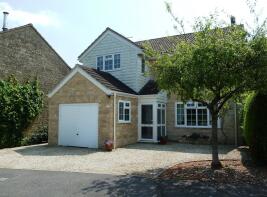
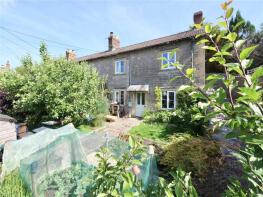
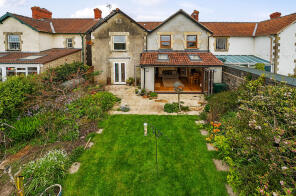
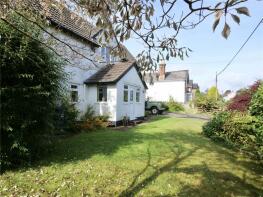
Properties Sold
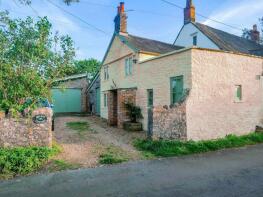
15, Chapelfield, Oakhill, Radstock BA3 5BU
| Today | See what it's worth now |
| 4 Mar 2026 | £490,000 |
| 10 Sep 2013 | £321,000 |
Tryfan, Heckley Lane, Ashwick, Shepton Mallet BA3 5BE
| Today | See what it's worth now |
| 28 Jan 2026 | £375,000 |
No other historical records.
Foxglove Cottage, Little London, Oakhill, Radstock BA3 5AU
| Today | See what it's worth now |
| 23 Jan 2026 | £240,000 |
| 21 Oct 2021 | £239,950 |
2, Gladstone Villas, Pound Lane, Oakhill, Radstock BA3 5BG
| Today | See what it's worth now |
| 3 Dec 2025 | £420,000 |
| 31 Jul 2006 | £240,000 |
No other historical records.
The Old Police House, Little London, Oakhill, Radstock BA3 5AU
| Today | See what it's worth now |
| 21 Nov 2025 | £585,000 |
| 5 Dec 2014 | £287,000 |
No other historical records.
Esters, Old Brewery Place, High Street, Oakhill, Radstock BA3 5GG
| Today | See what it's worth now |
| 9 May 2025 | £190,000 |
| 6 Feb 2015 | £164,000 |
No other historical records.
Elm Tree Villa, Little London, Oakhill, Radstock BA3 5AU
| Today | See what it's worth now |
| 30 Apr 2025 | £289,000 |
| 29 Jan 1999 | £65,000 |
No other historical records.
North View, Little London, Oakhill, Radstock BA3 5AU
| Today | See what it's worth now |
| 30 Apr 2025 | £399,950 |
| 21 Oct 2014 | £270,000 |
13, Withy Cottages, Bath Road, Oakhill, Shepton Mallet BA3 5AD
| Today | See what it's worth now |
| 23 Apr 2025 | £277,800 |
No other historical records.
Church Farm, Heckley Lane, Ashwick, Shepton Mallet BA3 5BE

| Today | See what it's worth now |
| 31 Mar 2025 | £1,250,000 |
No other historical records.
Meadow House, Pound Lane, Oakhill, Radstock BA3 5BG
| Today | See what it's worth now |
| 28 Mar 2025 | £637,000 |
| 3 Jul 2015 | £425,000 |
12, Sunnymead, Oakhill, Radstock BA3 5AX
| Today | See what it's worth now |
| 31 Jan 2025 | £190,000 |
| 29 Jan 2019 | £160,000 |
No other historical records.
Corner Cottage, Blackey Lane To Withy Lane, Neighbourne, Radstock BA3 5BQ
| Today | See what it's worth now |
| 17 Dec 2024 | £542,500 |
| 12 Feb 2014 | £347,500 |
7, The Granary, High Street, Oakhill, Radstock BA3 5FH
| Today | See what it's worth now |
| 29 Nov 2024 | £400,000 |
| 25 Jun 2021 | £385,000 |
The Kilderkin, Old Brewery Place, High Street, Oakhill, Shepton Mallet BA3 5GG

| Today | See what it's worth now |
| 27 Nov 2024 | £190,000 |
No other historical records.
Bridge View, Bath Road Access To Sewerage Works, Stratton On The Fosse, Radstock BA3 5AA
| Today | See what it's worth now |
| 31 Oct 2024 | £405,000 |
| 3 Apr 2019 | £235,000 |
No other historical records.
1, Stable Cottages, Bath Road, Oakhill, Radstock BA3 5HT
| Today | See what it's worth now |
| 30 Oct 2024 | £230,000 |
| 24 May 2013 | £162,000 |
The Cottage, Bath Road, Oakhill, Radstock BA3 5HT
| Today | See what it's worth now |
| 28 Aug 2024 | £380,000 |
| 19 Jul 2019 | £310,000 |
Sun Cottage, Pound Lane, Oakhill, Radstock BA3 5BG
| Today | See what it's worth now |
| 13 Aug 2024 | £377,500 |
| 18 Feb 2013 | £177,000 |
No other historical records.
Moorwood Cottage, Bays Lane, Oakhill, Radstock BA3 5BN

| Today | See what it's worth now |
| 31 Jul 2024 | £660,000 |
| 11 Jul 2008 | £430,000 |
Field House, Fosse Road, Oakhill, Radstock BA3 5HU
| Today | See what it's worth now |
| 28 Jun 2024 | £385,000 |
| 8 May 2017 | £310,000 |
1, Coronation Terrace, High Street, Oakhill, Radstock BA3 5FT

| Today | See what it's worth now |
| 14 Jun 2024 | £295,000 |
No other historical records.
Nelson Cottage, Pound Lane, Oakhill, Radstock BA3 5BG
| Today | See what it's worth now |
| 22 Apr 2024 | £350,000 |
| 2 Aug 2016 | £290,000 |
No other historical records.

Source Acknowledgement: © Crown copyright. England and Wales house price data is publicly available information produced by the HM Land Registry.This material was last updated on 9 July 2026. It covers the period from 1 January 1995 to 30 April 2026 and contains property transactions which have been registered during that period. Contains HM Land Registry data © Crown copyright and database right 2026. This data is licensed under the Open Government Licence v3.0.
Disclaimer: Rightmove.co.uk provides this HM Land Registry data "as is". The burden for fitness of the data relies completely with the user and is provided for informational purposes only. No warranty, express or implied, is given relating to the accuracy of content of the HM Land Registry data and Rightmove does not accept any liability for error or omission. If you have found an error with the data or need further information please contact HM Land Registry.
Permitted Use: Viewers of this Information are granted permission to access this Crown copyright material and to download it onto electronic, magnetic, optical or similar storage media provided that such activities are for private research, study or in-house use only. Any other use of the material requires the formal written permission of Land Registry which can be requested from us, and is subject to an additional licence and associated charge.
Rightmove takes no liability for your use of, or reliance on, Rightmove's Instant Valuation due to the limitations of our tracking tool listed here. Use of this tool is taken entirely at your own risk. All rights reserved.