
House Prices in Overchurch
House prices in Overchurch have an overall average of £217,140 over the last year.
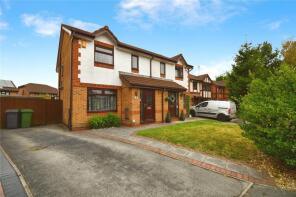
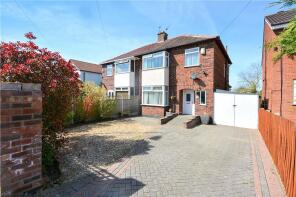
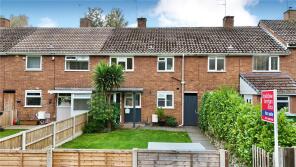
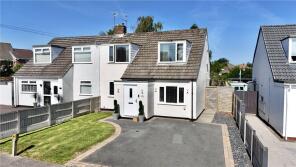
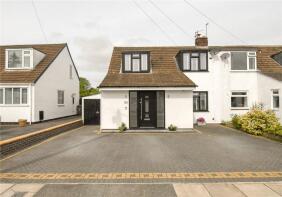
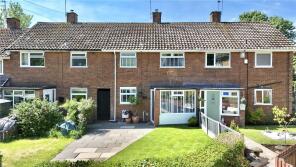
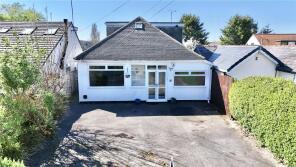
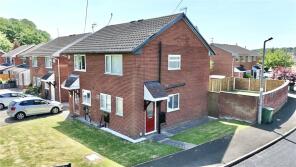
The majority of properties sold in Overchurch during the last year were semi-detached properties, selling for an average price of £230,017. Detached properties sold for an average of £266,333, with terraced properties fetching £181,250.
Overall, the historical sold prices in Overchurch over the last year were 6% up on the previous year and 3% up on the 2023 peak of £210,553.
Properties Sold
5, Furness Close, Wirral CH49 6QJ
| Today | See what it's worth now |
| 6 Mar 2026 | £245,000 |
| 7 Jan 2022 | £206,500 |
31, Overchurch Road, Wirral CH49 4NW
| Today | See what it's worth now |
| 6 Mar 2026 | £281,500 |
| 28 Sep 2021 | £250,000 |
125, Moreton Road, Wirral CH49 4NT
| Today | See what it's worth now |
| 27 Feb 2026 | £175,000 |
| 31 Jan 2014 | £119,000 |
3, Upton Park Drive, Wirral CH49 6JN
| Today | See what it's worth now |
| 10 Feb 2026 | £290,000 |
| 15 Jun 2001 | £58,000 |
No other historical records.
19, Websters Holt, Manorside Close, Wirral CH49 4RG
| Today | See what it's worth now |
| 5 Feb 2026 | £145,000 |
| 8 Dec 2015 | £94,000 |
27, Warwick Road, Upton CH49 6NF
| Today | See what it's worth now |
| 30 Jan 2026 | £330,000 |
No other historical records.
4, Websters Holt, Manorside Close, Wirral CH49 4RG
| Today | See what it's worth now |
| 28 Jan 2026 | £122,000 |
| 28 Nov 1995 | £45,450 |
No other historical records.
16, Butterton Avenue, Wirral CH49 4RA

| Today | See what it's worth now |
| 16 Jan 2026 | £170,000 |
| 19 Mar 2021 | £150,000 |
10, Girtrell Road, Wirral CH49 4LQ
| Today | See what it's worth now |
| 9 Jan 2026 | £260,000 |
| 19 Mar 2002 | £92,500 |
2, Pennystone Close, Upton CH49 4GA
| Today | See what it's worth now |
| 19 Dec 2025 | £250,000 |
No other historical records.
111, Saughall Massie Road, Wirral CH49 4RU
| Today | See what it's worth now |
| 11 Dec 2025 | £285,000 |
| 12 Apr 2021 | £165,000 |
No other historical records.
2, The Woodlands, Wirral CH49 6NQ
| Today | See what it's worth now |
| 4 Dec 2025 | £330,000 |
| 17 Oct 2002 | £42,750 |
No other historical records.
54, Royden Road, Upton CH49 4NA
| Today | See what it's worth now |
| 2 Dec 2025 | £152,000 |
No other historical records.
16, Gainsborough Road, Wirral CH49 4NF
| Today | See what it's worth now |
| 28 Nov 2025 | £165,000 |
| 1 Feb 2013 | £111,000 |
45, Norwich Drive, Wirral CH49 4QR
| Today | See what it's worth now |
| 26 Nov 2025 | £185,000 |
| 8 Jul 2016 | £134,000 |
2, Curlew Avenue, Upton CH49 4QA
| Today | See what it's worth now |
| 4 Nov 2025 | £195,000 |
No other historical records.
40, Gainsborough Road, Wirral CH49 4NF
| Today | See what it's worth now |
| 31 Oct 2025 | £76,500 |
| 24 Aug 2018 | £67,500 |
17, Hawksmore Close, Wirral CH49 4RE
| Today | See what it's worth now |
| 29 Oct 2025 | £197,500 |
| 22 May 1998 | £44,950 |
9, Upton Park Drive, Wirral CH49 6JN
| Today | See what it's worth now |
| 27 Oct 2025 | £300,000 |
| 27 Jul 2018 | £176,000 |
131, Moreton Road, Wirral CH49 4NT
| Today | See what it's worth now |
| 27 Oct 2025 | £195,000 |
| 23 Oct 2020 | £105,000 |
No other historical records.
61, Elm Avenue, Wirral CH49 4NP
| Today | See what it's worth now |
| 27 Oct 2025 | £337,000 |
| 8 Oct 2015 | £275,000 |
No other historical records.
1, Aylsham Drive, Wirral CH49 4QX
| Today | See what it's worth now |
| 24 Oct 2025 | £180,000 |
| 9 Oct 2020 | £137,000 |
114, Manor Drive, Wirral CH49 4LN
| Today | See what it's worth now |
| 24 Oct 2025 | £278,000 |
| 7 Dec 2017 | £165,000 |
No other historical records.
15, Wharton Close, Wirral CH49 4RF
| Today | See what it's worth now |
| 21 Oct 2025 | £285,000 |
| 21 Nov 2005 | £192,500 |
27, Aylsham Drive, Wirral CH49 4QX
| Today | See what it's worth now |
| 20 Oct 2025 | £190,000 |
| 20 May 2013 | £110,000 |
No other historical records.
Source Acknowledgement: © Crown copyright. England and Wales house price data is publicly available information produced by the HM Land Registry.This material was last updated on 15 May 2026. It covers the period from 1 January 1995 to 31 March 2026 and contains property transactions which have been registered during that period. Contains HM Land Registry data © Crown copyright and database right 2026. This data is licensed under the Open Government Licence v3.0.
Disclaimer: Rightmove.co.uk provides this HM Land Registry data "as is". The burden for fitness of the data relies completely with the user and is provided for informational purposes only. No warranty, express or implied, is given relating to the accuracy of content of the HM Land Registry data and Rightmove does not accept any liability for error or omission. If you have found an error with the data or need further information please contact HM Land Registry.
Permitted Use: Viewers of this Information are granted permission to access this Crown copyright material and to download it onto electronic, magnetic, optical or similar storage media provided that such activities are for private research, study or in-house use only. Any other use of the material requires the formal written permission of Land Registry which can be requested from us, and is subject to an additional licence and associated charge.
Map data ©OpenStreetMap contributors.
Rightmove takes no liability for your use of, or reliance on, Rightmove's Instant Valuation due to the limitations of our tracking tool listed here. Use of this tool is taken entirely at your own risk. All rights reserved.